




There is a number that should appear on every External Attack Surface Management (EASM) budget proposal, every board risk presentation, and every conversation between a CISO and a CFO who is not yet convinced that external attack surface visibility is worth the investment. That number is 62.
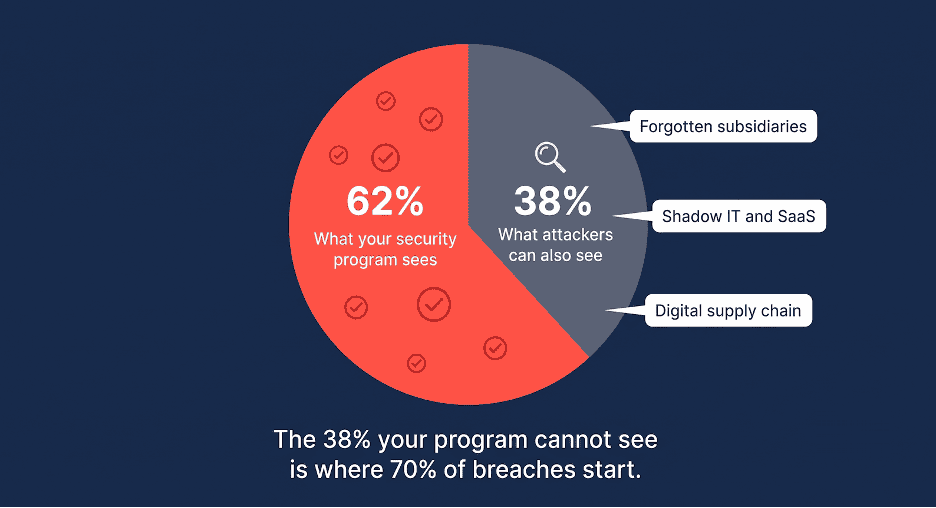
Research across enterprise deployments finds that organizations running standard discovery programs are aware of approximately 62% of their actual external attack surface. They can see the main domains, the known cloud environments, the documented subdomains. They cannot see the other 38%: the subsidiary acquired three years ago that still runs its own infrastructure, the marketing team’s SaaS deployment that has a corporate subdomain pointing at it, the development environment that was stood up for a project and never decommissioned, the third-party service provider whose platform carries organizational data and has an internet-facing portal nobody has audited.
That 38% is not an abstraction. It is where breaches begin. More than 70% of cybersecurity incidents in 2025 involved unknown or unmanaged assets as the initial entry point. Internet-facing application exploitation became the single largest initial access vector in 2026, up 44% year-on-year. The assets driving that trend are not the ones on the asset register. They are the ones nobody thought to put there.
This blog makes the business case for closing that gap: what creates the 38%, what it costs when attackers find it before you do, and what a concrete investment conversation looks like when you translate an attack surface visibility program into financial terms a CFO will recognize.
| 62% of their external attack surface the average enterprise can see (IONIX enterprise deployment research) | 70%+ of 2025 cybersecurity incidents involved unknown or unmanaged internet-facing assets (Trend Micro 2025) | 44% year-on-year increase in internet-facing application exploitation as initial access vector (IBM X-Force 2026) | 30-40% of large enterprise IT expenditure goes to shadow IT (Gartner 2024) |
What Creates the 38%: Three Structural Blind Spots
The visibility gap is not caused by negligence. It is caused by the structural reality of how organizations grow, how employees solve problems, and how technology procurement works in practice. The 38% does not appear on any asset register because it was never registered. Understanding the three sources of invisible attack surface is the first step toward quantifying it.
Blind Spot 1: Forgotten Subsidiaries and Acquired Infrastructure
Every acquisition brings an attack surface that does not automatically appear in the acquiring organization’s security program. The acquired company has its own domains, its own subdomains, its own cloud workloads, its own third-party integrations, and its own certificate landscape. In many cases, security integration into the parent company’s program takes months or years. In some cases, it never fully happens.
The result is infrastructure that carries the parent company’s legal liability and, in many cases, data connectivity to the parent company’s systems, but that sits entirely outside the parent company’s monitoring perimeter. Attackers performing reconnaissance on a target organization do not limit themselves to the primary brand domain. They enumerate every subsidiary, every related domain, and every IP range associated with the corporate entity. The security team’s inventory does not determine the attacker’s attack surface. The corporate registry and passive DNS history do.
A 2024 study found that organizations typically have 20 to 30% more internet-facing assets than they believe, with 15% of those assets presenting critical security risks. For organizations that have completed even one acquisition in the past five years, the actual figure is likely higher.
Blind Spot 2: Shadow IT and Unauthorized SaaS Deployments
The average enterprise believes it uses approximately 91 cloud services. The real number, measured against actual network traffic and identity provider logs, averages 1,220. The gap of more than 1,100 unauthorized services represents cloud infrastructure that exists, generates credentials, handles data, and creates network connections entirely outside the visibility of the security program.
Shadow IT is not malicious in intent. It exists because procurement timelines do not match business timelines, because approved tools have limitations that unauthorized alternatives solve, and because the friction of going through IT approval is higher than the immediate productivity cost of working around it. Gartner estimated in 2024 that 30 to 40% of large enterprise IT expenditure goes to shadow IT. That is not a rounding error in the asset inventory. It is a structural feature of how modern organizations operate.
Every shadow IT deployment that has an internet-facing component is part of the organization’s external attack surface whether or not it appears in any security tool. Every SaaS account opened with a corporate email address, every subdomain pointed at a freemium marketing tool, every cloud storage bucket created outside the approved cloud account is an asset that attackers can discover, that may hold sensitive data, and that the security team cannot patch, cannot monitor, and cannot include in incident response.
Blind Spot 3: The Digital Supply Chain
The third source of invisible attack surface is the one that has proven most consequential in recent years: the digital supply chain. Every vendor that has an internet-facing portal through which they serve the organization, every SaaS provider whose platform carries organizational data, every managed service provider whose tools touch the internal network, is an extension of the organization’s attack surface.
62% of breaches now involve a third-party vendor as the initial entry point. The downstream impact on the breached organization is identical whether the initial access was through the organization’s own infrastructure or through a trusted vendor’s. The legal exposure is the same. The regulatory notification requirement is the same. The reputational consequence is the same. But the security program’s visibility into the vendor’s internet-facing infrastructure is typically close to zero.
The Reconnaissance Asymmetry
An attacker performing reconnaissance on a target organization maps the entire external attack surface: primary domains, subsidiary domains, IP ranges, cloud workloads, and third-party infrastructure carrying organizational data. They use certificate transparency logs, passive DNS, internet-wide scan databases, and automated OSINT tools. This process takes minutes to hours, costs nothing, and produces a more complete picture of the organization’s external exposure than the organization’s own asset inventory. The security program’s visibility boundary is the attacker’s opportunity boundary. Everything the security program cannot see is something the attacker can potentially exploit without triggering any internal alert. The 38% that organizations cannot see is not evenly distributed across low-risk assets. It concentrates in exactly the categories that attackers prioritize: forgotten systems with unpatched software, unauthorized deployments with weak credentials, and vendor portals with minimal security controls.
What the 38% Costs: Translating Visibility Gaps into Financial Terms
The business case for external attack surface visibility is, at its core, a risk-adjusted cost calculation. The CISO’s job in a budget conversation is to translate the technical reality of a visibility gap into the financial exposure that the CFO and board are equipped to evaluate. Three numbers anchor that conversation.
The Cost of a Breach Originating from an Unknown Asset
The IBM 2025 Cost of Data Breach Report places the global average breach cost at $4.88 million. Breaches originating from unknown or unmanaged assets carry a premium over that average: they take longer to detect (the organization has no monitoring on the asset), longer to contain (the organization may not have documented the asset’s connections to other systems), and produce higher remediation costs as a result.
The 194-day average time to detect a breach falls to a significantly shorter window when the compromised asset is actively monitored. When the compromised asset is not in any inventory, the clock does not start until the breach manifests in a system that is monitored, typically long after the attacker has completed lateral movement, data staging, and exfiltration. The dwell time premium on unknown-asset breaches directly translates to a cost premium.
The Probability of Attack via Unmanaged Assets
More than 70% of 2025 cybersecurity incidents involved unknown or unmanaged internet-facing assets as the initial entry point. This is not a marginal risk category. It is the dominant risk category for initial access. An organization that has made significant investments in endpoint detection, email security, and network monitoring but has not addressed external attack surface visibility has protected the channels it can see while leaving the channel that accounts for the majority of initial access events almost entirely undefended.
The expected loss calculation follows directly: if more than 70% of incidents originate from unknown assets, and the organization cannot see 38% of its external attack surface, the probability that the next breach will originate from the invisible 38% is substantially higher than from the visible 62% where defensive investment is concentrated.
The Regulatory Cost of Invisible Third-Party Exposure
NIS2 and DORA both impose obligations on organizations to maintain visibility into their external asset inventory and their vendor ecosystem. NIS2 requires entities to document and manage supply chain security as part of their risk management measures. DORA requires financial entities to maintain a Register of Information covering all ICT third-party contractual arrangements.
An organization that cannot see its own external attack surface cannot satisfy these requirements. A supervisor asking for a complete inventory of internet-facing assets will find gaps. A supervisor asking for a documented assessment of third-party digital risk will find undiscovered vendor relationships. The regulatory risk of an invisible attack surface is not theoretical. It is a documented compliance gap in any organization subject to these frameworks.
| Cost Category | Source of Risk | Financial Exposure |
| Breach cost: unknown asset origin | Longer dwell time due to absence of monitoring on unmanaged assets; higher containment cost due to undocumented system connections | Premium above $4.88M average; IBM data shows extended dwell time adds $1M+ to average breach cost |
| Incident frequency from unmanaged assets | 70%+ of 2025 incidents originated from unknown or unmanaged internet-facing assets | Majority of breach probability concentrated in the 38% the security program cannot see |
| Regulatory penalties: NIS2 | Incomplete asset inventory; undocumented supply chain relationships; inadequate third-party risk management | Up to 2% of global annual turnover for essential entities; up to 1.4% for important entities |
| Regulatory penalties: DORA | Incomplete Register of Information; inadequate ICT third-party risk documentation | National competent authority enforcement; escalating penalty structures for persistent non-compliance |
| Reputational and market impact | Breach disclosure involving assets the organization did not know existed; board and regulator questions about governance maturity | Public companies average 3 to 10% stock price decline post-disclosure; customer churn varies by sector |
| What Does Your 38% Cost If an Attacker Finds It First? Brandefense surfaces your external exposure, including the assets no other security tool is watching, before the cost calculation becomes real. Book a Demo |
Why Discovery-Only Programs Still Leave the Gap Open
Many organizations that have deployed an EASM solution discover that they are still operating with significant visibility gaps. The reason is that first-generation EASM programs, and many tools still marketed today, solve for a specific narrower problem: they scan known IP ranges and domains for internet-facing assets. They find assets that are connected to what the organization already knows about.
The 38% that creates the visibility gap is not connected to what the organization already knows about. Forgotten subsidiaries have different domain registrations. Shadow IT deployments have subdomains or cloud workloads that are not enumerated from the primary domain. Digital supply chain exposure exists on the vendor’s infrastructure, not the organization’s. A scanner that starts from known assets and expands outward will find more of what the organization already knows it has. It will not find the organizational entity relationships, acquisition history, and vendor ecosystem mapping that covers the blind spots.
The Difference Between Asset Discovery and Attack Surface Management
Asset discovery answers the question: what internet-facing assets exist at IP ranges and domains I tell it to scan? It is a necessary starting point and an improvement over no inventory. But it is bounded by what the organization can tell it to scan.
Attack surface management answers a different question: what internet-facing assets exist that are associated with this organization, including subsidiaries, acquisitions, shadow IT deployments, and third-party relationships, regardless of whether those assets appear in any internal inventory? It starts from the organizational entity, not from the known IP range. The 38% visibility gap is, in large part, the difference between those two questions.
Building the EASM Business Case: What to Put in Front of the CFO
The business case for external attack surface visibility follows a structure that CFOs recognize from any risk management investment: expected loss reduction justifies program cost. The CISO’s job is to populate that structure with numbers that are defensible, not to produce a precise actuarial calculation, but to establish that the risk being managed is real, quantified, and worth the investment relative to the cost of the program.
Step 1: Quantify Your Current Invisible Surface
Before any other number goes into a business case, the organization needs to know what it cannot see. This is where an external attack surface assessment begins: not with a list of known assets but with a discovery exercise that builds from the organizational entity outward, enumerating subsidiaries, related domains, historical IP ownership, and third-party relationships.
The output of this exercise is typically surprising to both the security team and the business. A mid-sized enterprise that believes it manages 200 internet-facing assets commonly discovers 400 to 600. A large enterprise may find two to three times its expected footprint. The discovery exercise is not just a security deliverable; it is a quantification of the investment case itself. The number of previously unknown assets with security findings is the direct denominator in the breach probability calculation.
Step 2: Attach Financial Exposure to Specific Findings
Not all invisible assets carry equal financial exposure. A forgotten staging environment with no data connectivity carries different risk than a vendor portal that processes customer payment data or a subsidiary’s VPN endpoint that connects to the parent company’s network. The business case is strongest when specific high-risk findings from the discovery exercise are translated into specific financial exposure: this unpatched internet-facing system, which we did not know existed, carries $X in breach risk based on the data it connects to and the breach cost experience for our sector.
Step 3: Calculate the Comparison
The comparison the CFO needs to evaluate is: cost of the external attack surface visibility program versus expected value of breach risk reduction. The expected value calculation multiplies breach probability by breach cost. For the invisible 38% of the attack surface, where 70% of incidents originate, that probability is substantial, and the breach cost premium from extended dwell time on unmonitored assets makes the breach cost figure higher than the average.
A simplified version of this calculation for a mid-market organization might look like this: average breach cost in the sector, multiplied by the probability of a breach originating from an unknown asset in a given year, produces an expected annual loss figure. The external attack surface visibility program cost as a percentage of that expected loss is the ROI denominator. Organizations that have run this calculation report that a single avoided breach typically produces an investment payback ratio of 3:1 to 10:1 depending on sector and program cost.
Step 4: Frame Continuous Monitoring as Operational Efficiency, Not Just Risk Reduction
The fourth element of the business case addresses a concern CFOs and CISOs both share: the operational cost of managing more discovered assets. Discovery that produces a longer list without prioritization creates analyst workload, not risk reduction. The business case for continuous external attack surface management, as opposed to periodic discovery, is that it replaces ad hoc, reactive asset discovery with a systematic, prioritized workflow that identifies which newly discovered or changed assets require immediate attention and which can be addressed in scheduled maintenance cycles.
Organizations that deploy continuous monitoring against their complete external footprint report significant reductions in mean time to detect externally exposed vulnerabilities, measured in hours rather than weeks or months compared to the periodic assessment model. That reduction translates directly to dwell time reduction and, therefore, to breach cost reduction in the scenarios where a vulnerability in an external asset is exploited before the discovery cycle would have surfaced it.
How Brandefense Closes the 38% Gap
| Capability | How It Addresses the Visibility Gap |
| Organizational entity mapping | Builds the complete organizational entity map before scanning a single asset: subsidiaries, acquisitions, affiliated brands, and related domains; this is the foundation that discovery-only tools skip |
| Continuous external asset discovery | Maps internet-facing assets associated with the full organizational entity, not just known IP ranges; surfaces forgotten subdomains, abandoned cloud workloads, and shadow IT deployments |
| Digital supply chain visibility | Identifies vendor and third-party infrastructure carrying organizational data or providing access to organizational systems; addresses the supply chain component of the visibility gap |
| NIS2 and DORA asset inventory support | Provides the continuous, comprehensive asset inventory that satisfies the documentation requirements of both frameworks; surfaces ICT third-party relationships not captured in official procurement records |
| Critical vulnerability alerting | Prioritizes discovered assets by risk rather than producing an undifferentiated list; surfaces high-risk findings in the invisible 38% for immediate response rather than creating additional analyst workload |
| Continuous 24/7 monitoring | Detects new assets and changes to existing assets as they occur; new shadow IT deployments, newly registered subsidiary domains, and newly exposed vendor portals surface within hours of creation |
| RELATED READING Shadow IT: Why the Assets Your IT Team Does Not Know About Are Your Most Dangerous Entry Points: https://brandefense.io/blog/shadow-it-hidden-attack-surface/ : the technical mechanics of how shadow IT creates invisible attack surface 62% of Breaches Now Start With a Vendor: https://brandefense.io/blog/the-rise-of-supply-chain-cyber-attacks/ : how the digital supply chain component of the visibility gap translates into breach risk NIS2 and DORA Compliance for TPRM: https://brandefense.io/blog/nis2-dora-third-party-risk-management/: the regulatory requirements that mandate asset inventory visibility as a compliance obligation Why Vendor Security Questionnaires Do Not Work: https://brandefense.io/blog/why-vendor-security-questionnaires-dont-work/ : why point-in-time assessments cannot surface the digital supply chain exposure that continuous monitoring finds |