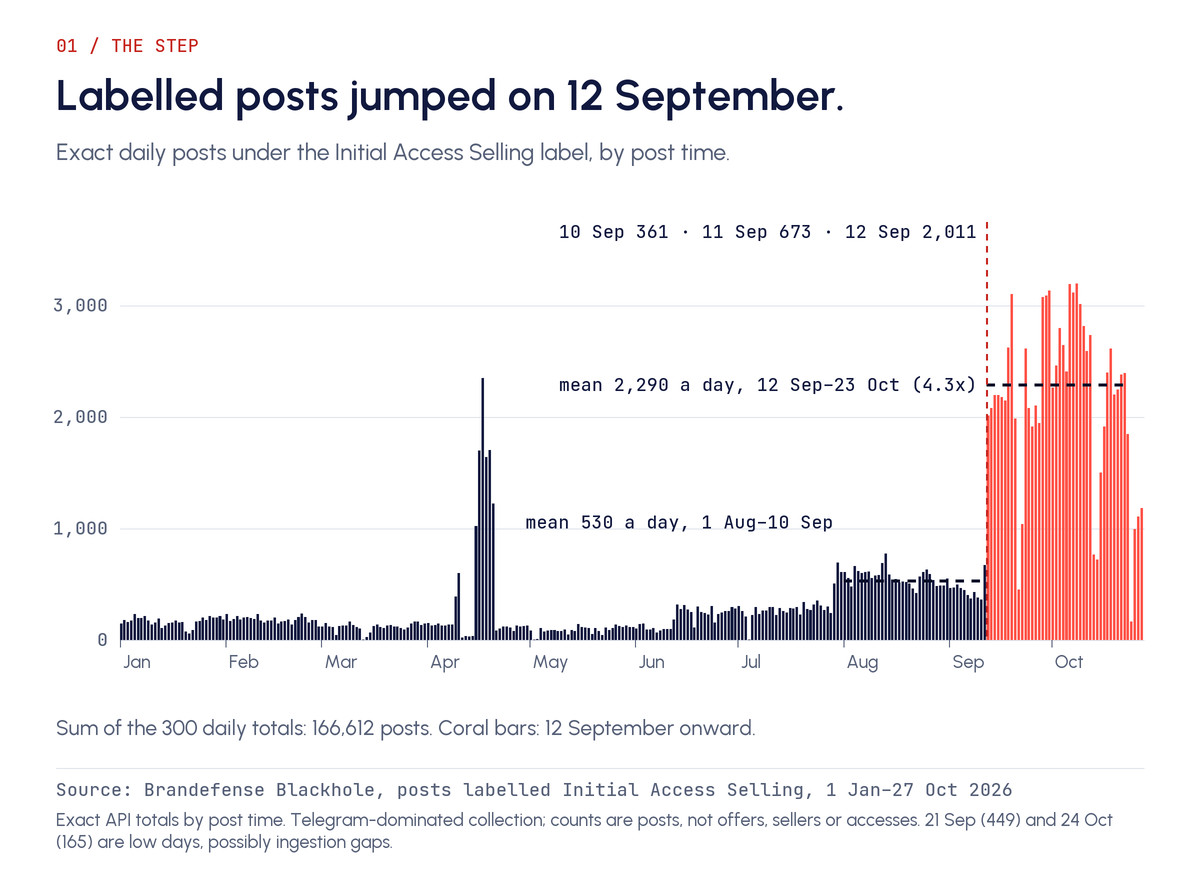
On 10 September 2026, Blackhole collected 361 posts labelled as initial access sales. On 12 September it collected 2,011. The mean rose from 530 posts a day (1 August to 10 September) to 2,290 a day (12 September to 23 October), a factor of 4.3.
Access selling did not show a matching rise. Once repeated copies are removed by cleaning, offer posts ran at about 24 a day before the step and about 38 after. That de-duplicated comparison is the preferred one.
Compared directly, the after-to-before ratio is about 1.6, with an approximate 95% range of 0.8 to 3.1. That is no detectable change, though a smaller rise cannot be ruled out.
Counting every copy, offers fell. This article tests five explanations for the extra posts, including our own first guess, which the data rejected.
What Happened Between 10 and 12 September?
The step took two days: 361 posts on 10 September, 673 on 11 September, 2,011 on 12 September and 2,078 on 13 September. Apart from two likely collection gaps (21 September, 449; 24 October, 165), daily counts then ranged from about 720 to 3,196 (8 October). Monthly totals were 17,457 in August, 46,920 in September and 57,666 in October through the 27th. Cleaned counts come from a full fetch of every window.
The series had stepped before. A burst on 15 to 20 April ran at 1,022 to 2,351 posts a day, against roughly 20 to 120 on the quiet days either side.
On 29 and 30 July the count rose from about 270 a day to 500 to 700. So the 530-a-day baseline was already raised. Two days look like collection gaps: 21 September (449) and 24 October (165).
The label comes from a classifier, and we cannot see why it labels more posts on a given day. We can only read what it labelled. Our main sample pooled January to August, so for this test we drew 110 fresh posts from 1 August to 11 September, the baseline closest to the step.
Test One: Was It Persian VPN Configuration Sharing?
Our first hypothesis came from a look at the top channels in September. Several were Persian-language channels that share free VPN and proxy configuration files. That is circumvention tooling, not a sale of access. If those channels drove the step, the jump would be a labelling artifact of harmless traffic.
The sample rejected it. Configuration sharing was 7.9% of post-step posts, and it added about 143 posts a day to a rise of about 1,760, roughly 8%. The estimate’s range crosses zero. Configurations are present, but they are not where most of the extra posts came from.
Test Two: Did More People Start Selling Access?
Counting every copy, the picture reverses. In the 1 August to 11 September sample, 54.5% of posts were offers (41.9% to 66.6%), about 291 offer posts a day (223 to 355). After the step, about 107 a day (44 to 247). For these full-period rates (1 August-11 September versus 12 September-27 October), the fall is about 184 offer posts a day (290.9 minus 106.8).
The separate step-window decomposition uses 530 labelled posts a day for 1 August-10 September and 2,290 for 12 September-23 October, multiplied by the sample offer shares; its offer rates are 288.9 and 112.8, a fall of about 176 a day (rough band -302 to -50).
One repeated shell and cPanel bot ad explains it. It filled 8,477 posts in the window, about 202 a day or 37.8% of all labelled posts, and about three quarters of the offer posts. None of its copies survive cleaning. Without it, offers ran at about 69 a day (37 to 122).
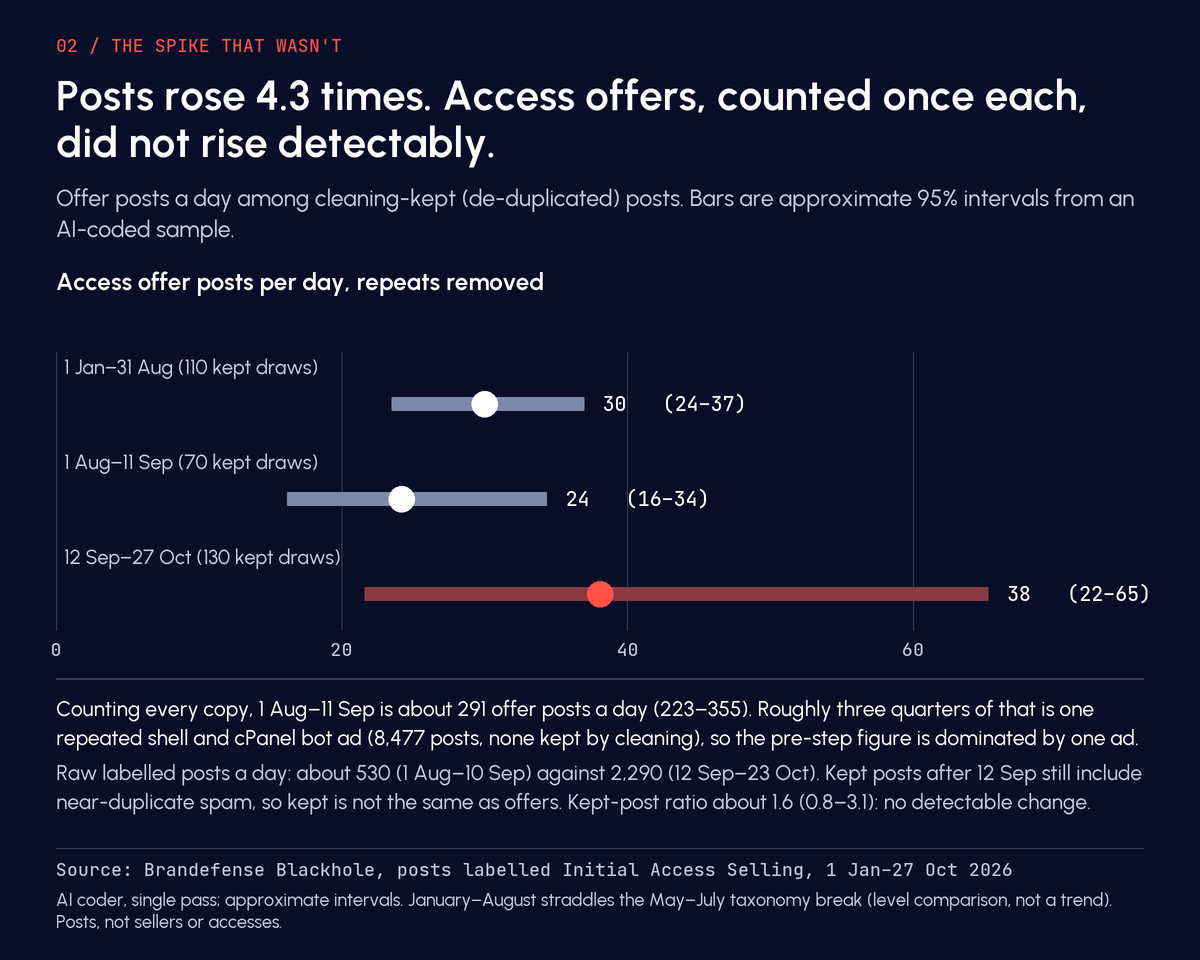
The cleaner comparison removes repeats first. De-duplicated offer posts ran at about 24 a day (16 to 34) from 1 August to 11 September. From 12 September to 27 October they ran at about 38 a day (22 to 65). Compared directly under this model, the after-to-before ratio is about 1.6, with an approximate 95% range of 0.8 to 3.1.
That range includes 1, so we see no detectable change. It stays below 4, so the data do not support a fourfold rise in de-duplicated offer posts. A smaller rise or a fall cannot be ruled out. The ratio rests on 19 offers in 70 kept draws before the step and 11 in 130 after.
Test Three: What Were the Extra Posts?
The label gained about 1,760 posts a day. We split that rise by category. Before-shares come from the 1 August to 11 September sample (about 530 posts a day), after-shares from the post-step sample (about 2,290 a day). Ranges are rough.
- Consumer account selling: +809 a day (46% of the rise).
- Carding, mule and SIM buying: +380 a day (22%).
- Repeated spam: +256 a day (15%).
- Shared VPN and proxy configurations: +143 a day (8%).
- Chat and unclassified posts: about +242 a day.
- Smaller categories (other, news, hosting ads): about +140 a day.
- Access offers: −176 a day. Buyer requests for shells: −38 a day.
The offer decline follows the bot ad above. A single slogan family does not explain the step either. About 7,200 near-identical posts, in a Chinese-language slogan about buying VPN traffic, were spread across 124 channels. The family was first seen on 18 September, six days after the step.
The step is breadth, not repetition. Distinct message families rose from about 292 a day (1 August to 10 September) to 1,318 a day (12 September to 23 October). The 15 largest post-step families hold 27.5% of posts from 12 September to 27 October. Ten of them first appeared after 11 September and hold 18.7%.
Test Four: Did New Channels Arrive?
If a batch of new channels had joined on 12 September, the step could be an ingestion event. The channel data say mostly not. Of post-step posts, 69.8% came from channels that already had labelled posts in the baseline window, and 19.1% from channels first seen after 11 September.
Channels seen before 11 September went from about 530 labelled posts a day to about 1,850. Of those, 1,569 channels rose and 748 fell. The ten biggest risers account for 24.6% of the gross increase, and the top 50 for 48.5%.
The five largest channels held 42.1% of posts before the step and 12.7% after. The rise was broad across existing sources, not one channel and not one new batch.
Test Five: Did the Whole Feed Get Busier?
If collection had simply grown, other labels would rise too. We compared daily means for 12 to 30 September against 25 August to 10 September.
| Label | Ratio | Change per day |
|---|---|---|
| Initial Access Selling | 4.67 | +1,735 |
| Phishing | 1.92 | +4,197 |
| Carding | 1.74 | +2,192 |
| Combolist | 1.13 | +88 |
| Data Leak | 0.52 | −2,083 |
| Malicious Software | 0.51 | −1,068 |
| Botnet Log | 0.33 | −1,065 |
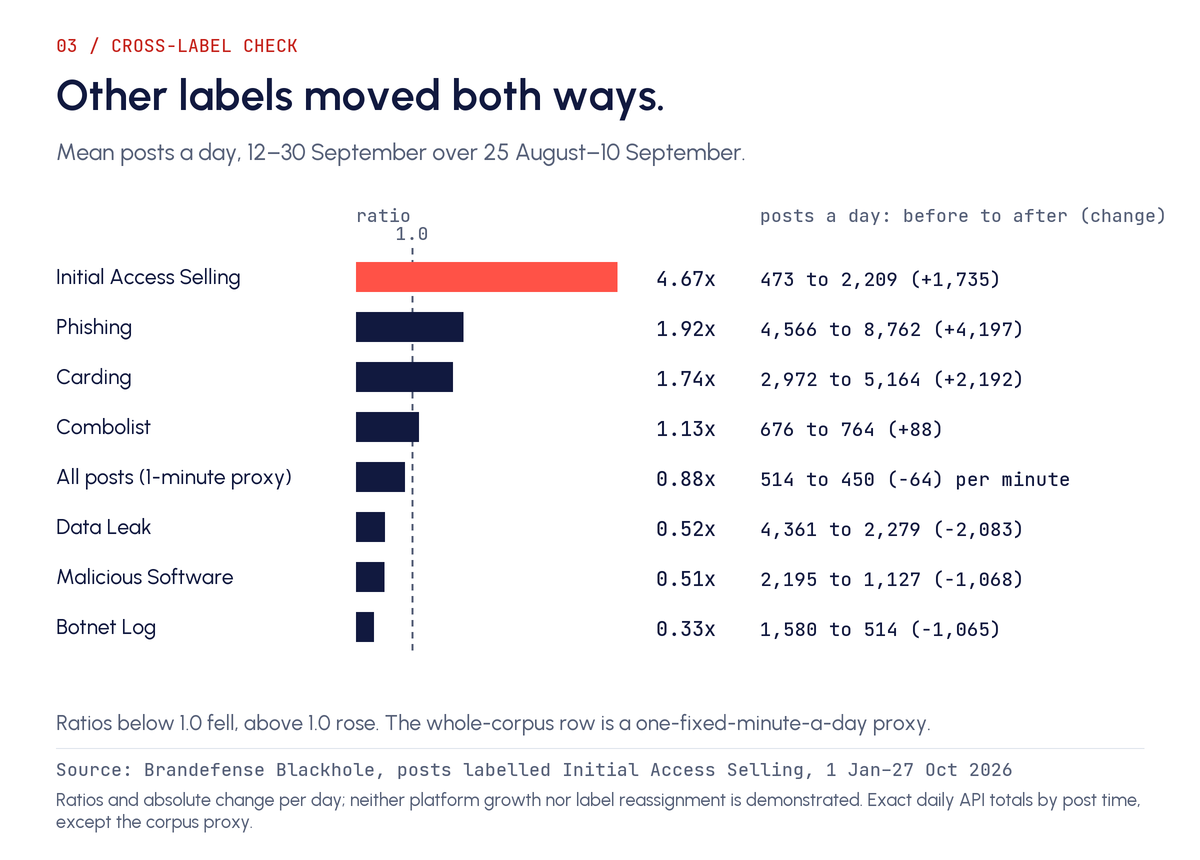
Initial Access has the largest ratio, but Phishing and Carding gained more posts a day in absolute terms. Three labels lost about 1,000 to 2,000 posts a day each. A one-minute proxy for total volume stayed about flat (0.88).
The table does not show platform-wide growth. It does not show label reassignment either. It shows that label counts can move by thousands of posts a day. For the access label, offers did not change detectably, and only that label was coded.
Why Is a Feed-Volume Alert Not a Threat Level?
The count under one label quadrupled. De-duplicated offer posts did not change detectably, and most of the added volume was other content. An alert on the label count would have fired on 12 September and told an analyst nothing about access selling.
These measures describe the object better than the label does:
- Offer posts per day from a coded sample, with an interval, and with repeated copies counted once.
- Distinct message families per day, which showed here that the step was breadth.
- The type of access offered: website, server or network. The main investigation of initial access offers shows how little of the label is network access.
- A control label beside the one you watch, with changes in absolute posts, not only ratios.
For a team that buys or builds threat feeds, the practical step is to ask which of these a headline number is. A figure for “access sales” that is a classifier count should not enter a board slide as a threat level.
What This Test Cannot Show
We do not know why the classifier or the collection changed. We have no view of closed forums. An AI coder classified the sample, and a separate AI pass agreed on offer versus not-offer in 89 of 90 posts (98.9%; three-class 88.9%, kappa 0.75).
That shows consistency, not human validation. The April burst and the July step were not sampled separately, and the post-step offer ranges are wide. Nothing here says the dark web grew or shrank, or predicts later activity.
Method Notes and Related Reading
The counts come from Blackhole-collected posts, mostly from Telegram, for 1 January to 27 October 2026. The research methodology gives the sampling design and cleaning rules. The Initial Access research edition links the evidence catalogue and the other investigations.
Test Two compares offer posts among cleaning-kept posts, 1 August to 11 September against 12 September to 27 October. Offers in each period’s kept draws are treated as independent binomial counts, with kept posts held fixed (3,748 in 42 days, then 20,698 in 46). The approximate 95% range for the ratio is a profile-likelihood interval. It does not cover coding errors, changes in collection coverage or cleaning choices.
Corporate network offers cannot explain the step. We found 120 of them in ten months. That is tiny next to a rise of 1,760 posts a day, and two more October offers exist only among cleaned-out posts. The analysis of corporate network access listings reads them.
Mule and SIM buying belongs to the Fraud research edition. For vocabulary, see the initial access broker glossary entry and web shell.
Why AI agents. Brandefense Blackhole, our cybercrime database, collects around 17 to 23 million dark web and Telegram posts a month. Reading that volume by hand, and linking a recruitment ad on one forum to a leak-site claim on another and a price list in a Telegram channel weeks later, is beyond what a human team can do alone.
Claude Opus 5.5 prepared the research: it searched the data, sorted and translated posts and drafted the text. Codex Astra then checked every number against the dataset files and tested each claim, and anything that did not hold was removed.
Brandefense analysts reviewed and approved the findings.